slug: dental-practice-growth-benchmarks
meta_description: Benchmark your dental practice revenue, patient volume, and treatment acceptance against top performers. Get metrics, goals, and a competitive analysis template.
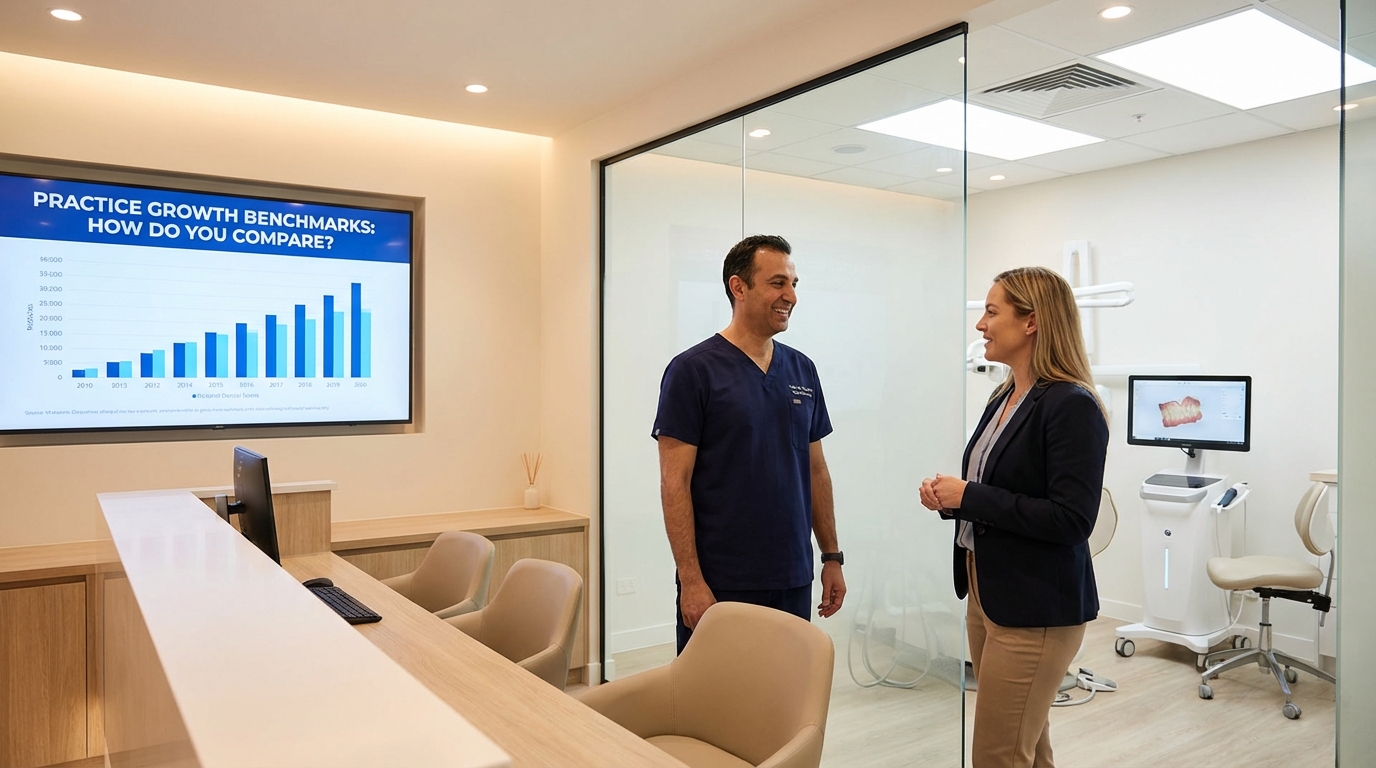
Dental Practice Growth Benchmarks: How Do You Compare?
By KamGeneral1,825 words9 min read
Introduction
You're in a peer study group. Dr. Johnson mentions her practice hit $1.2M revenue last year with 4 doctors. Dr. Williams says she's at $950K with 3 doctors—and stressed about growth.
Same market. Different results.
The gap isn't usually talent or location. It's visibility into what's working.
Most dental practices operate without clear benchmarks. You might think your 42% case acceptance rate is solid, but if top performers in your market hit 65%, you're leaving $200K+ on the table. You might believe your patient volume is maxed out, but if equivalent practices close more high-value cases, you're not maxed out—you're under-positioned.
This article gives you the 8 benchmarks that separate top-performing practices from the rest—and a framework to measure yourself today.

The 8 Critical Benchmarks Every Practice Should Track
Benchmark 1: Revenue Per Patient
Definition: Total annual revenue ÷ Total unique patients seen
Top performer target: $1,200–$1,800/patient/year
Industry average: $800–$1,100/patient/year
Why it matters: This metric shows whether you're extracting value from your patient base or just volume-chasing. High-revenue practices do fewer, higher-value cases. Low-revenue practices see more patients and do lower-margin work.
How to improve:
- Increase cosmetic case volume (higher revenue per hour)
- Bundle treatment (patient in chair → multi-visit plan vs. single visit)
- Implement implant programs (implant cases $3K–$6K vs. filling $300)
Benchmark 2: Case Acceptance Rate (Overall)
Definition: (Number of cases accepted ÷ Number of cases presented) × 100
Top performer target: 60–75%
Industry average: 35–50%
Why it matters: This is your sales efficiency. A 60% acceptance rate means 3 out of 5 presented cases land. At 40%, you're missing 2. Over a year, the difference is $300K–$600K in lost revenue.
How to improve:
- Digital smile design for cosmetic cases (adds 20–30% to acceptance)
- Same-day treatment coordinator presentation (doctor + coordinator = higher acceptance)
- Financing options upfront (removes price objection)
- Patient testimonials and case studies visible in consultation room
Benchmark 3: Implant Percentage of Revenue
Definition: (Total implant revenue ÷ Total revenue) × 100
Top performer target: 25–40% of revenue
Industry average: 5–15%
Why it matters: Implant cases are high-value, high-margin, and high-satisfaction. Every 5% increase in implant revenue = $50K–$100K/year for most practices. This is where the money is.
How to improve:
- Train hygienists to identify implant candidates
- Create implant consultation process (separate from general dentistry)
- Partner with oral surgeons for surgical expertise if needed
- Market implants specifically (patients don't default to implants; they need education)
Benchmark 4: Cosmetic Revenue Percentage
Definition: (Total cosmetic revenue ÷ Total revenue) × 100
Top performer target: 15–30%
Industry average: 5–10%
Why it matters: Cosmetic cases are acceptance-heavy and price-friendly. They're also great for building social proof and referrals. Practices with 20%+ cosmetic revenue typically have 2x the brand recognition and patient loyalty.
How to improve:
- Build a cosmetic case study library (before/afters drive acceptance)
- Position cosmetic dentistry on your website and social media
- Train team to present cosmetic upgrades (shade matching, veneer refinement)
- Use digital smile design in consultations
See Why Cosmetic Dentistry ROI Matters More Than Chair Time for detailed cosmetic revenue strategies.
Benchmark 5: Patient Retention Rate
Definition: (Number of active patients from prior year still active) ÷ (Total patients from prior year) × 100
Top performer target: 85–95%
Industry average: 70–80%
Why it matters: Retaining a patient costs 1/10th the effort of acquiring one. A 90% retention rate with 800 patients means 80 new patients/year is your growth number. At 70%, you need 240 new patients to stay flat. Retention is growth.
How to improve:
- Implement a patient recall system (automated email/text reminders)
- Loyalty program (discount on cosmetic cases, free whitening, etc.)
- Follow-up after major treatment (call 48 hours post-op)
- Annual "state of your mouth" review (encourages re-engagement)
Benchmark 6: Average Case Value (Crown/Bridge vs. Implant vs. Cosmetic)
Definition: Average revenue per completed case, segmented by case type
Top performer targets:
- Standard cases (fillings, extractions, crowns): $800–$1,500/case
- Implant cases: $3,500–$6,000/case
- Cosmetic cases: $2,500–$5,000/case
Industry average:
- Standard: $600–$1,000
- Implant: $2,500–$4,000
- Cosmetic: $1,500–$2,500
Why it matters: This shows whether you're under-pricing relative to market and your market segment. If your cosmetic average is $1,200 and top performers hit $4,000, you're either under-pricing or not filtering for high-intent cases.
How to improve:
- Audit your fee schedule against regional benchmarks
- Raise prices on high-demand services (cosmetic, implant)
- Bundle services to increase case value (whitening + veneers = higher total)
- Position yourself as premium if you're competing on quality
Benchmark 7: Treatment Coordinator Revenue Per Hour
Definition: Total revenue from cases presented/accepted ÷ Coordinator hours spent on consultations
Top performer target: $150–$250/hour
Industry average: $75–$125/hour
Why it matters: Your treatment coordinator is a revenue generator, not just a scheduler. High-performing coordinators close 60%+ of presented cases. If your coordinator's "revenue per hour" is low, either you're under-pricing or they need training.
How to improve:
- Use visual presentation tools (iPad, smile design, 3D models)
- Require treatment plan presentation same-day (verbal + written)
- Train on benefit-focused language ("you'll feel confident" vs. "this costs $3K")
- Track acceptance rate by coordinator to identify training gaps
Benchmark 8: New Patient Acquisition Cost
Definition: Total marketing spend ÷ Number of new patients acquired
Top performer target: $100–$200/new patient
Industry average: $150–$300/new patient
Why it matters: If you're spending $300 to acquire each patient and your average new patient revenue is $1,000, you break even in Year 2. If you're acquiring at $150, you're profitable immediately. Digital marketing has made this metric more trackable and competitive.
How to improve:
- Use Google Local Services Ads (highest ROI for dental)
- Run Facebook/Instagram ads to local interest audiences
- Ask referral sources to refer (dentists refer 3x more than random advertising)
- Implement patient referral incentives ($25–$50 per successful referral)

The Benchmark Matrix: Where Do You Stand?
Use this matrix to grade yourself. Count the number of "top performer" benchmarks you hit:
| Benchmark | You | Top Performer | Gap | Action |
|---|---|---|---|---|
| Revenue per patient | $_____ | $1,200–$1,800 | ||
| Case acceptance rate | ___% | 60–75% | ||
| Implant revenue % | ___% | 25–40% | ||
| Cosmetic revenue % | ___% | 15–30% | ||
| Retention rate | ___% | 85–95% | ||
| Avg cosmetic case | $_____ | $2,500–$5,000 | ||
| Coordinator revenue/hr | $_____ | $150–$250 | ||
| CAC (new patient) | $_____ | $100–$200 |
Scoring:
- 6–8 green: You're top 10%. Keep your system, scale it.
- 4–5 green: You're competitive but have 1–2 big leaks. Fix the gap with biggest revenue impact (usually implants or case acceptance).
- 2–3 green: You're losing $300K–$600K/year. Prioritize revenue-per-patient and case acceptance improvements first.
- 0–1 green: System overhaul needed. Consider hiring a business coach or DSO partnership to implement benchmarks.
The Top 3 Benchmark Improvements for Fastest Revenue Growth
Priority 1: Case Acceptance Rate (Biggest ROI)
If you're at 40% and improve to 55%, you immediately unlock an extra 15% revenue with zero new patients.
30-day action plan:
- Week 1: Audit last 30 cases. Calculate your real acceptance rate by case type.
- Week 2: Document which cases are rejected and why (price, timing, distrust).
- Week 3: Implement visual presentation tool (iPad smile design or 3D model).
- Week 4: Measure acceptance rate. Track weekly.
Expected result: +8–12% acceptance rate improvement in 30 days = $80K–$150K/year revenue lift.
Priority 2: Implant Revenue Percentage (Highest Margin)
If implants are 8% and you grow to 20%, you've fundamentally shifted your revenue model.
30-day action plan:
- Identify implant-candidate cases from last 90 days (any missing tooth or hopeless tooth).
- Create 1-page implant education sheet for hygienists to hand out.
- Schedule 1 implant consultation per week as a "test" practice.
- Document results and patient feedback.
Expected result: +5–10% implant revenue growth in 90 days = $150K–$300K/year revenue lift (compounded).
Priority 3: Cosmetic Revenue Percentage (Relationship Building)
If cosmetic is 6% and you grow to 15%, you've built a brand that attracts quality patients.
30-day action plan:
- Create a cosmetic case study library from best 10 before/after cases.
- Design a simple 1-page cosmetic menu (veneers, whitening, bonding) with pricing.
- Train hygienists to say "Dr. mentioned cosmetic options" instead of assuming patients don't want cosmetics.
- Feature 1 case study on website or social media per week.
Expected result: +4–8% cosmetic revenue in 60 days = $40K–$100K/year revenue lift. Q: Should I compare myself to practices in my state or my market? A: Start local (same metro area), then expand to state if sample size is small. Regional variables (cost of living, patient demographics, insurance mix) matter significantly. A $1.2M practice in Manhattan looks different than one in rural Ohio.
Q: How often should I recalculate benchmarks? A: Monthly for case acceptance and coordinator revenue/hour. Quarterly for revenue-per-patient and case-type averages. Annually for retention and implant percentages (longer cycles).
Q: What if I hit all my benchmarks but still feel stuck? A: You might be optimizing the wrong metrics. Ask: Is revenue the constraint, or is it your time/energy? If it's time, the answer isn't benchmarks—it's delegation or DSO partnership.
Q: Can a solo practice hit top-performer benchmarks? A: Yes, with discipline. Solo practices often beat multi-doctor groups on case acceptance and cosmetic revenue because of personal brand. They may lag on patient volume, but they hit higher case values.
Q: What's the fastest way to improve multiple benchmarks at once? A: Fix case acceptance first (impacts all revenue benchmarks). Then layer in implant/cosmetic positioning (changes case type mix). Retention improvements take longer but compound over years.
Q: Should I focus on revenue-per-patient or new patient volume? A: Revenue-per-patient first. It's faster to move the needle and compounds. New patient volume is important for long-term growth but should be optimized after you're extracting maximum value from current patients. Your practice's potential isn't invisible—it's in the numbers.
Book a free strategy call — Let's benchmark your practice against top performers and identify your biggest revenue opportunity (usually $150K–$400K/year).
Book a free website audit — See how your online presence compares to top-performing competitors in your market.
Frequently Asked Questions
Ready to Close More Cases?
Book a free strategy call and see how we help dental practices add 40+ new patients in 90 days.
Book Your Free Strategy CallRelated Articles

General6 min read
Asheville Dental Marketing Agency Playbook for High-Value Case Growth
Asheville Dental Marketing Agency Playbook for High-Value Case Growth
General7 min read
Atlanta Dental Marketing Agency Pricing: What It Takes to Buy Consistent Implant Cases
Atlanta Dental Marketing Agency Pricing: What It Takes to Buy Consistent Implant Cases
General6 min read
Back-to-School Revenue Reset for Dental Practices
Reset your practice for the back-to-school rush with scheduling, messaging, and financing systems that turn seasonal slumps into predictable consults.