Publish Date: April 6, 2026
CTA: Book a free strategy call → https://www.closingmorecases.com/contact-us
Target Keywords: dental marketing metrics, Knoxville dental marketing, track dental marketing ROI, dental practice KPIs, dental marketing Knoxville TN
Knoxville Dental Marketing Metrics to Track (And What They Actually Mean for Revenue)
By KamGeneral2,089 words10 min read
TL;DR
Most Knoxville dental practices are running marketing blind — spending on ads and SEO without tracking the numbers that actually predict revenue. This guide covers the 12 essential dental marketing metrics every Knoxville practice should monitor, how to calculate them, and what benchmarks to compare yourself against in a competitive Southeast market.

Introduction
Marketing without metrics is just spending. But inside most Knoxville dental practices, the conversation around marketing performance sounds something like this: "Is it working?" — followed by a shrug.
The Knoxville metro has become a genuine battleground for dental market share. Between the University of Tennessee campus traffic, the population growth spilling south toward Maryville and north toward Powell, and the influx of patients who can afford premium care, Knoxville practices have a real opportunity to grow. But opportunity means nothing without a system to measure, optimize, and double down on what's actually working.
The problem is most dental marketing dashboards are filled with vanity metrics — website sessions, social media likes, ad impressions — that look impressive in a monthly report but have zero correlation with new patients booked or treatment plans accepted.
This guide cuts through the noise. We're covering the 12 dental marketing metrics that actually matter for Knoxville practices, how to calculate each one, what good looks like, and how connecting these numbers to revenue will transform how you allocate your marketing budget.

1. The Foundation: Tracking the Right Dental Marketing KPIs in Knoxville
Before diving into individual metrics, it helps to understand why most dental practices track the wrong things. Agency reports default to traffic and impressions because those numbers always go up — they're easy to grow with a credit card. But what a practice owner in Knoxville actually cares about is: how many high-value patients booked this month, and what did it cost to get them?
Start With the Revenue-First Framework
Every metric worth tracking maps back to one of three questions:
- Are we attracting the right patients? (Lead quality metrics)
- Are we converting interest into booked consults? (Conversion metrics)
- Are we turning consults into accepted treatment plans? (Case acceptance metrics)
A useful external benchmark: according to the American Dental Association's practice management data, healthy practices convert at least 65–75% of new patient phone calls into scheduled appointments. If you're below that in Knoxville, no amount of ad spend will fix it — you have a front-desk or follow-up process problem first.
For an overview of what a full dental marketing system looks like, see our guide: How to Get More Dental Implant Patients.
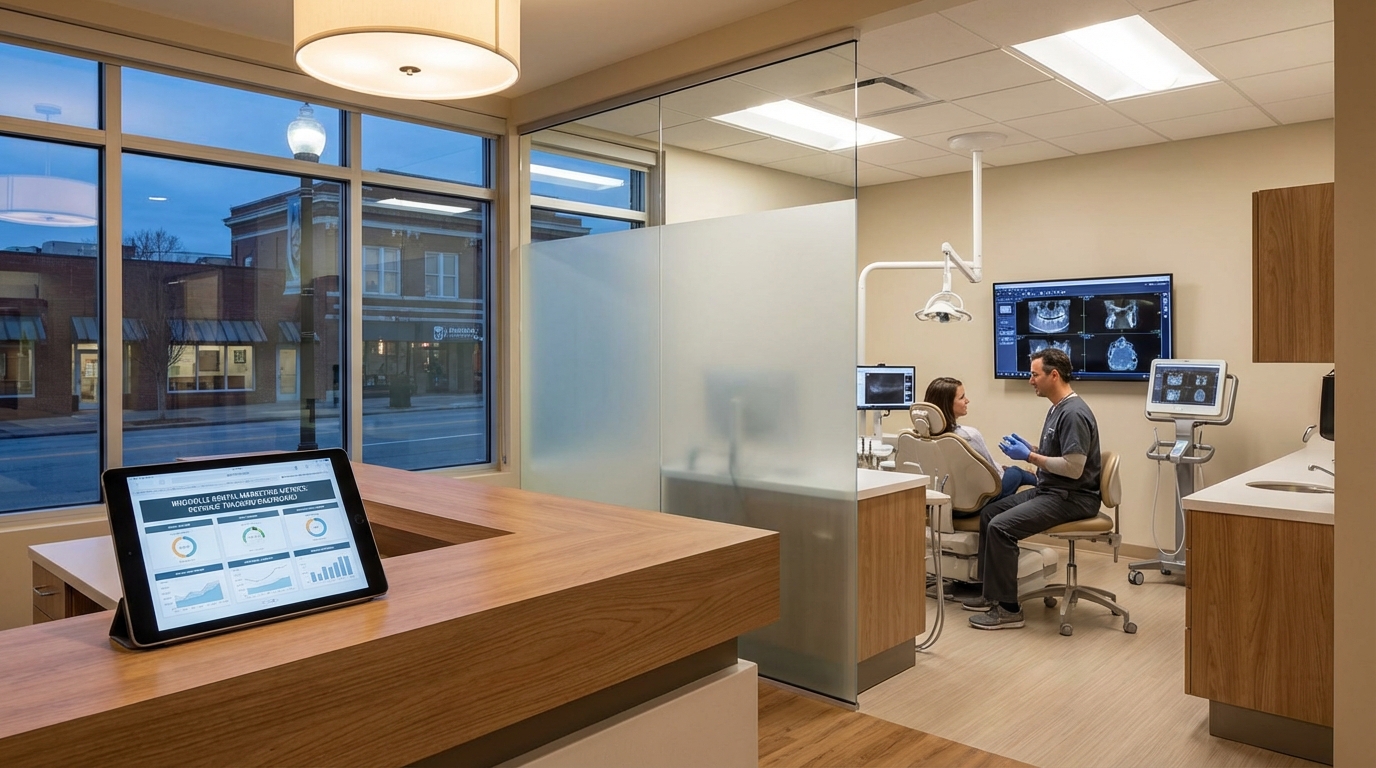
Build a Simple Marketing Dashboard
You don't need enterprise software. A spreadsheet updated weekly — or a simple CRM with pipeline tracking — is enough to get started. The goal is one source of truth that ties ad spend to consult bookings to treatment accepted. Once you have that, everything else becomes cleaner.
2. Lead Generation Metrics: Are Knoxville Patients Finding You?
Lead generation metrics tell you whether your marketing is putting your practice in front of the right people. In Knoxville's competitive landscape, "more traffic" is meaningless if it's the wrong traffic.
Cost Per Lead (CPL)
Formula: Total marketing spend ÷ total leads generated
Knoxville benchmark: $35–$90 for general dentistry; $80–$180 for implant leads
CPL is your first filter. A dental implant lead at $150 is excellent — that's a potential $3,000–$6,000 case. A cosmetic consultation lead at $200 needs scrutiny unless the average case value justifies it.
Track CPL separately by channel: Google Ads, organic SEO, Facebook/Instagram, and referrals. Knoxville practices often find that organic search leads cost 60–70% less per lead than paid — but take 6–12 months to build. A strong strategy mixes both.
Lead Source Attribution
Do you know which marketing channel is producing each lead? This is where most Knoxville practices fail completely. If you can't answer "how did this patient hear about us?" for 90%+ of your leads, you're flying blind.
Set up proper UTM tracking in Google Analytics, use a call-tracking number per channel (CallRail is popular in dental), and train your front desk to ask — and record — every new patient's source.
Impression-to-Click Rate (CTR) for Dental Ads
For Google Ads, a healthy CTR for dental keywords in Knoxville runs 4–8%. Below 3% means your ad copy isn't resonating with local searchers. Test headlines that speak to specific Knoxville-area concerns: financing options, same-day consults, or proximity to specific neighborhoods like Farragut, Bearden, or West Hills.
For Google organic search, a top-3 ranking for "dental implants Knoxville TN" should yield 15–30% CTR. If you're ranking but not getting clicks, your meta title and description need work.
3. Conversion Metrics: Turning Knoxville Interest Into Booked Appointments
Traffic and leads mean nothing if your website and phone process aren't converting. These metrics reveal friction in your patient acquisition funnel.
Website Conversion Rate
Formula: Consult form submissions (or calls) ÷ website visitors × 100
Knoxville benchmark: 2–5% for dental websites; 6–10%+ for high-performing landing pages
The average dental website converts around 2–3%. A well-optimized page targeting "Knoxville dental implants" with clear CTAs, trust signals (before/afters, reviews, doctor credentials), and a frictionless booking form can push that to 8–12%.
If your Knoxville practice website converts below 2%, that's the single highest-leverage fix available. More traffic won't help — you'll just lose more leads faster.
For a breakdown of what a high-converting dental page looks like, see our Dental Implant Consultation Conversion Rate guide.
Phone Answer Rate and Speed-to-Lead
Industry standard: Answer 80%+ of calls within 3 rings; respond to web leads within 5 minutes during business hours.
MIT research shows that responding to a web lead within 5 minutes vs. 30 minutes produces a 100x improvement in contact rate. In Knoxville's competitive market, a patient who fills out a consult form and doesn't hear back within an hour will book with your competitor — full stop.
Cost Per Appointment Booked
Formula: Total marketing spend ÷ appointments booked
Knoxville implant benchmark: $150–$350 per booked consult
This is the metric your marketing agency should be held accountable to — not rankings, not impressions, not "brand awareness." How much did it cost to put a patient in your chair? Everything else is noise.
4. Case Acceptance and Revenue Metrics: Closing the Loop
The final layer of your marketing metrics system connects front-end marketing to back-end revenue. This is where dentistry becomes a real business.
Case Acceptance Rate
Formula: Accepted treatment plans ÷ total treatment presentations × 100
Knoxville benchmark: 50–65% overall; 40–55% for large cases ($3K+)
The national average case acceptance rate hovers around 50%. Top-performing practices — the ones consistently hitting $1M+ in annual collections — run 65–75%. The gap is almost never clinical. It's systems: how the treatment is presented, how financing is discussed, and how follow-up is handled.
If your Knoxville practice is below 50% acceptance on implant cases, you likely have a presentation problem, not a patient quality problem. See our deep-dive: Dental Implant Consultation Scripts That Close.
Revenue Per New Patient
Formula: Total production from new patients in a period ÷ number of new patients
Knoxville benchmark: $800–$1,500 for general; $2,500–$5,000 for implant-focused practices
This single metric tells you whether you're attracting high-value patients or filling chairs with low-production cases. A Knoxville practice averaging $800 revenue per new patient needs very different marketing than one averaging $3,500.
If your revenue per new patient is low, the problem may be marketing targeting (are you attracting implant-qualified patients, or $150 cleaning patients?), case presentation, or financing availability.
Patient Lifetime Value (LTV)
Most dental marketing conversations focus obsessively on acquisition — getting the new patient in the door. But in Knoxville's market, retention and LTV are the real differentiators.
Formula: Average annual patient value × average patient retention in years
A patient who comes in for implants, then stays for hygiene, then refers two family members is worth $15,000–$25,000 over their lifetime. Track LTV by acquisition channel — you'll often find that SEO-driven patients stay longer than paid-ad patients.
5. Local and Competitive Benchmarks for Knoxville Practices
Knoxville's dental market has unique characteristics worth benchmarking against. The metro spans multiple affluent corridors — Farragut and West Knoxville skew higher-income and more insurance-optional; North Knoxville and the downtown core have a broader income mix. Your benchmarks should reflect your target geography.
Key Knoxville-specific benchmarks to track:
- Local pack visibility: Are you in the Google Maps 3-pack for "dental implants Knoxville" and the top 3–4 surrounding neighborhoods?
- Review velocity: Knoxville's top-performing dental practices are adding 8–15 new Google reviews per month. Below 4/month puts you at risk of being outranked by newer competitors.
- Competitor share of voice: Use tools like SEMrush or Ahrefs to see what percentage of local dental keywords your practice ranks for vs. your top 3 competitors. This is your market visibility score.
For an inside look at how this plays out in a neighboring market, read: Greenville, SC Implant Marketing Blueprint.
The Metrics Dashboard Template
Here's a simple monthly tracking sheet structure for Knoxville practices:
| Metric | This Month | Last Month | 90-Day Avg | Target |
|---|---|---|---|---|
| New leads (all channels) | ||||
| Cost per lead | ||||
| Appointments booked | ||||
| Cost per appointment | ||||
| Case acceptance rate | ||||
| Revenue per new patient | ||||
| Google review count |
Update this weekly. Share it with your marketing partner. Tie marketing budget decisions to it. The practices that grow predictably are the ones that operate with this level of clarity.
Frequently Asked Questions
Q: What's the most important dental marketing metric for a Knoxville practice to track?
A: Cost per appointment booked — because it ties your entire marketing spend directly to revenue potential. If you only track one thing, make it this.
Q: How do I know if my Google Ads are working for my Knoxville dental practice?
A: Track cost per click, cost per lead, and cost per booked appointment separately. A campaign might have a low cost per click but high cost per appointment due to poor landing page conversion. All three metrics together tell the real story.
Q: What's a good case acceptance rate for dental implants in Knoxville?
A: 45–55% is average; 60–70% is excellent. If you're below 40%, the issue is almost always presentation style, financing options, or follow-up — not patient quality or pricing.
Q: How do I track which marketing channel is sending the best patients?
A: Use call tracking (CallRail or similar) to assign unique phone numbers per channel, UTM parameters on all digital campaigns, and train your front desk to record referral source for every new patient. After 90 days, you'll have clear data on CPL and revenue by channel.
Q: Should Knoxville dental practices care about social media metrics?
A: Only in context. Instagram followers and Facebook likes are vanity metrics unless you can connect them to website traffic, consult bookings, or patient conversions. Focus on social media's contribution to leads booked — not raw engagement numbers.
Q: How often should I review my dental marketing metrics?
A: Weekly for leading indicators (leads, calls, appointments booked), monthly for revenue metrics (case acceptance, revenue per new patient), and quarterly for strategic benchmarks (LTV, share of voice, competitor tracking).
Ready to Know Exactly What Your Marketing Is Producing?
Most Knoxville dental practices are leaving revenue on the table because they don't have a clear picture of what's working and what's wasting budget. We build marketing systems that are fully transparent — every dollar tied to a booked consult and every campaign optimized around case production, not vanity metrics.
Book a free strategy call and we'll show you how to build a Knoxville dental marketing dashboard that drives real revenue decisions.
Frequently Asked Questions
Ready to Close More Cases?
Book a free strategy call and see how we help dental practices add 40+ new patients in 90 days.
Book Your Free Strategy CallRelated Articles

General6 min read
Asheville Dental Marketing Agency Playbook for High-Value Case Growth
Asheville Dental Marketing Agency Playbook for High-Value Case Growth
General7 min read
Atlanta Dental Marketing Agency Pricing: What It Takes to Buy Consistent Implant Cases
Atlanta Dental Marketing Agency Pricing: What It Takes to Buy Consistent Implant Cases
General6 min read
Back-to-School Revenue Reset for Dental Practices
Reset your practice for the back-to-school rush with scheduling, messaging, and financing systems that turn seasonal slumps into predictable consults.